We use cookies to make your experience better. By continuing to visit this website you agree to our use of cookies. More information can be found in our Privacy Policy.

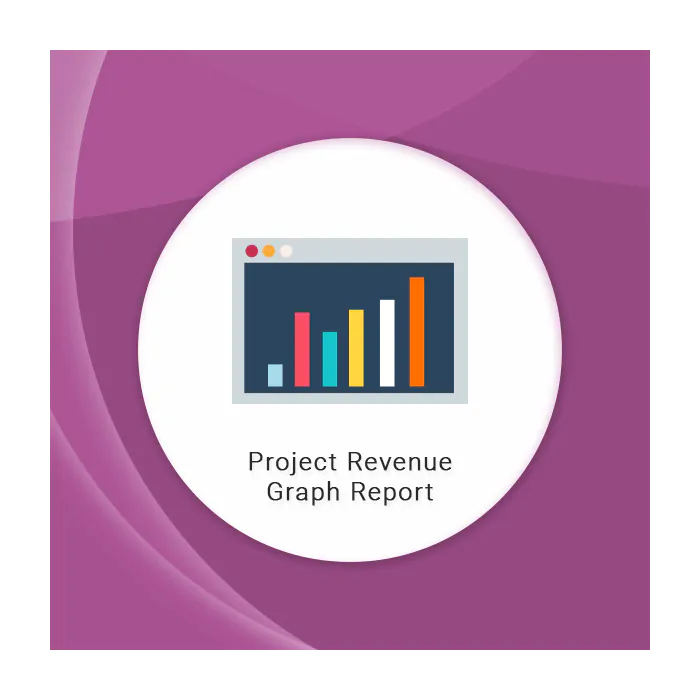
Project Revenue Report Graph
$49.00
In stock
Project revenue graph report app provides a graphical representation of your project budgeted cost and actual cost which is calculated by employees timesheet entries.
With the help of this app the project manager can keep track of everything, from the big picture to the minute details, from the customer contract to the billing.
Analyzed the Project budget hour and actual hour
Project Manager can analyze the project budget hour and actual spend hour in graph view.
Follow and Manage progress of Project
With the help of bar chart,line ,pie graph project manager can track the progress of project
Download report in excel format
Users can download the report in excel format.
| Version | 16.0 |
|---|---|
| Format | Download |
| Match Version | Yes |
| Compatible with | ODOO 14, ODOO 15, ODOO 16 |
| Support |
Comes with
-
FREE Updates
and Improvements -
One Month
FREE Support -
Risk-FREE
30-day Money Back
Write Your Own Review